Working with a short term type of trading style requires the need to master the technical analysis side of things. Learning to pick which charts to look at and knowing how to appropriately read them is going to help you out a lot over the long term. Charts are an essential part of learning how to trade binary options; you will not be profitable for long if you don’t know the ins and outs of chart reading. You will also need to know how to apply the best types of technical analysis tools onto the charts so that you can gain a deeper understanding.
Binary Options Charts
Broker
Min. Deposit
Min. Invest
Review
Min. Deposit
USD 10Min. Invest
USD 1Min. Deposit
$10Min. Invest
$1Min. Deposit
$20Min. Invest
$1Min. Deposit
$20Min. Invest
$1Binary Options Trading Charts
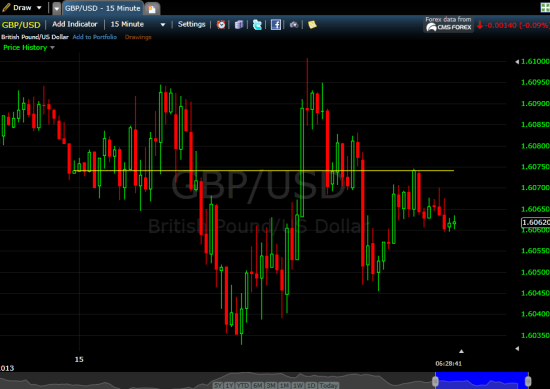
You might be surprised to learn that there are more than one type of charts. Basically, the more detail you can squeeze in, the better. This is why candlestick charts are the best for traders. Bar and line charts are great for some purposes, but no other type of chart is able to fit in the same amount of information in a small space that a candlestick chart can. Plus, these charts can easily be color coded and this can give you even more insight at a gland into exactly what your particular asset is doing. Whenever you can, choose a candlestick chart. One free option that you have is called FreeStockCharts.com. They offer a decent package to get you started, but you may want something more polished depending on your needs.
Time it right
Now that you know what type of chart you want, your search is not yet over. You need to pick the right timeframe, too. This is actually pretty easy. You want to start right where you are. So if you are trading 10 minute binary options, you want to look at a 5 minute price charts.
But, as you’ve probably guessed, it’s not quite this easy. You also need to expand your scope. Looking at the price chart for one notch up and one notch down can achieve this for you beautifully. Again, let’s assume that we are looking at 10 minute options. In this instance, you would want to look at both five minute intervals and half hour long intervals. This will give you a feel of the short term fluctuations that might occur for you and also will let you see the overall direction and trend that the market might be currently moving in. Both of these pieces of information need to be taken into account if you want to tackle this subject correctly.
MetaTrader (MT4)
If you are trading currency pair binary options, there is no greater charting tool than the MetaTrader. This is a real time software program that you will need to download onto your desktop. It will update currency price charts as price changes occur, letting you see firsthand every move that the market makes. If you have traded in the Forex market before, odds are that you have used this tool. Many Forex brokers will even allow you to trade directly from the MetaTrader charts that are generated. As of right now, you can’t do this with binary trading since they do not especially focus on currencies, but the extra program running on your computer should not be a problem.
Other assets
When you are trading other assets, such as stocks, indices, and commodities, you will need some other charting package that will update prices in real time for you. There are several good programs out there that you can use, some of which you might have to pay for to use. It doesn’t really matter which you decide to go with, but make sure that the programs you are using will update in real time. Fast paced action requires your charts to update quickly or you will always be behind. This can be extremely costly to you because it will ultimately lead to you making errors in judgment, so the price that you pay for a real time price chart package will definitely offset itself for you over time.
Trading Patterns
You will find, with candlestick charts, that there are certain patterns that appear over and over again. These can be important markers of where an asset’s price is headed, actually, so you need to pay attention to them. The problem here is that there are so many patterns out there and many of them are not applicable to certain styles of trading. If you wish to use chart patterns to assist you with your decisions, some trial and error will be necessary. Look around at your trading behaviour and make sure that the patterns that you are looking at will actually be helpful to you.
Using a Journal
A trading journal will be of big benefit to you. Copy and paste the charts that you use into these journals and you will have a visual record of your decision making process that you can go back to learn new things. Google has a great way for you to do this, if you have a Google account.
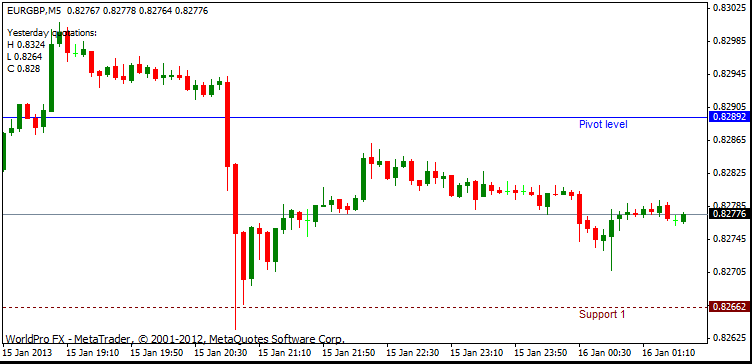
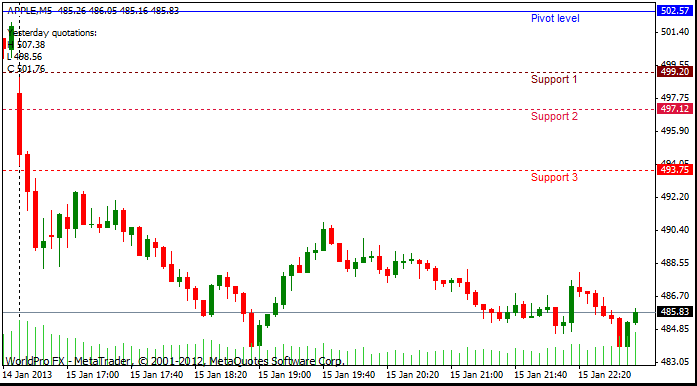
Free Binary Options Charts
To some it may appear confusing to look at; when in fact, it is really easy to understand. Once you get everything loaded on the chart you will see exactly what we are looking at. Pivot, support, and resistance lines will tell you a story that will help.
First, we recommend you to get any MT4 charting package. All binary brokers have different price feeds, so it isn’t uncommon for you to see one price, while others see something different. This is why having the same charting package will make things even cleaner for you to understand the charts.
Here are some things you should consider on the charts after they are setup.
- You can edit the pivot, support and resistance colors in the editing area.
- The horizontal lines can also be adjusted size wise. This may make it easier to see for some.

A very important item to discuss is the price differential between the actual binary brokers. Prices change so fast that you may not see the difference, but there will be those times when you are questioning the broker for slippage. This price movement is just part of trading in general. There may be some kind of arbitrage trading strategy to look at in the future, but for now, be aware of these price differences.
Also, price on the MT4 chart will definitely be different than the price at the binary option broker because of the spread.Some spreads are fixed and other can change at any moment. The price you see on the chart is the bid price. In most trading formats there is a bid and ask price for buyers and sellers. With Binary brokers you see the actual price. This is something you should pick up on relatively quick.

If you are having a hard time understanding candlesticks, there is a course that will give you everything you need to know about charting. Steve Nison is the original western hemisphere guy when it comes to Japanese candlesticks and provides you with sound information which in turn helps you out with price action.
Once you get your chart setup at the particular broker of your choice you can then start watching price action around these lines. Remember these lines won’t always hold in the direction you want. They are guidelines to watch as price moves. You use them to make better educated guesses of what price will do next. Over time you will learn a lot about how price moves throughout the day. Once you’ve spent many hours in front of the charts finding solid binary trade setups will be much easier. The time you put in now, will help you save a lot of time and money down the line.

Another aspect of the MT4 charting package that we like to use are alerts. These alerts can be set to tell you when price has reached a certain level on the chart. This allows you to do other things and not miss a potential trade setup. There is a tab on the chart that let’s you set these alerts in seconds. These come in handy and also let’s you stay out of the market when conditions aren’t favorable.
It may take you some time to learn all the intricacies of the MetaTrader chart, but over time it will become pretty clear. There are a lot of different things you can do with them. Being a binary trader we use it for price action. If you ever decide to trade spot Forex, knowing these charts will come in hand. It’s better to get the education you need before risking your money.
*** Resource Information ***
A pivot point calculation looks like this:
Pivot(P)=(H+L+C)/3 Basic math will give you the calculation of the pivot.
Key = P=Pivot – H=High – L=Low – C=Close
The great thing about the indicator is that it does everything for you on a nightly basis. This means the plotted lines will not have to be calculated by you every night. It is completely automated. It’s a very nice feature to have as a trader.
Here is how you find all the resistance and support levels, using the calculation from above.
Resistance(R1) = (2×P)−L
R2 = P+H−L
R3 = H+2×(P−L)
Support(S1) = (2×P)−H
S2 = P−H+L
S3 = L−2×(H−P)
Binary Options Graph Analysis
Traders with some exposure to the binary options markets have probably come across the term Technical Analysis when reading the educational materials offered by brokers. Many new traders, however, are surprised when they hear that binary options positions can be based entirely on the price patterns and the historical market behavior that can be found on charts.
But the fact is that technical price analysis is used by a wide majority of the active market community and when approached correctly, technical analysis can enable traders to identify new opportunities that might not otherwise be visible. Here, we will look at what price analysis is and the way it can be used to construct trading ideas and enhance the probability that individual positions unfold in a favorable (profitable) way.
At its core, technical analysis is a way to evaluate the true value of an asset by analyzing historical price behavior as it is represented on a chart. A technical analyst is not interested in economic data, projections for future corporate earnings or even the identity of the underlying asset. All a technical analyst is watching is the way in which prices have behaved in the past, and this information will be used to forecast how prices are likely to perform in the future.
Since technical price analysts look at the historical performance of an asset (and believe that this performance will be replicated in the future), traders use this approach to define specific price levels that define trades place in active markets. When trading binary options, this essentially means that traders can use technical analysis to create a broad directional forecast (prices moving either up or down) and exact strike prices for executed positions. This information can be critical when defining your parameters for individual trades.
One of the ways Technical Analysis is most useful is in showing areas where basic levels of supply and demand are likely to present themselves in the future. As always, we must remember that excessive supply pushes prices lower, while excessive demand pushes price higher.
If we look at a price chart, see that prices are trending higher, and reach a plateau before reversing, we can see that excessive supply in hitting the market. If prices move upward toward this level again in the future, we would expect a similar market reaction (a downward reversal) and this would be viewed by technical analysts as a prime area for entering into PUT options for that asset.
Conversely, when prices are trending lower (and reach a major trough before reversing), we can see that excessive demand is entering the market as investors look to buy the asset at cheaper prices. If prices move downward toward this level again in the future, we would expect a similar market reaction (an upward reversal) and this would be viewed by technical analysts as a prime area for entering into CALL options for that asset.
Technical analysis methods can prove to be a highly valuable when traders are looking to determine which ways an asset is likely to trade in the future and at which levels reversals will be seen. When traders focus on the historical price behavior of a single asset, it becomes simpler to assess the value of a stock, commodity or currency in an error-free manner. For these reasons, technical analysis has become an increasingly popular staple of the market trading community.
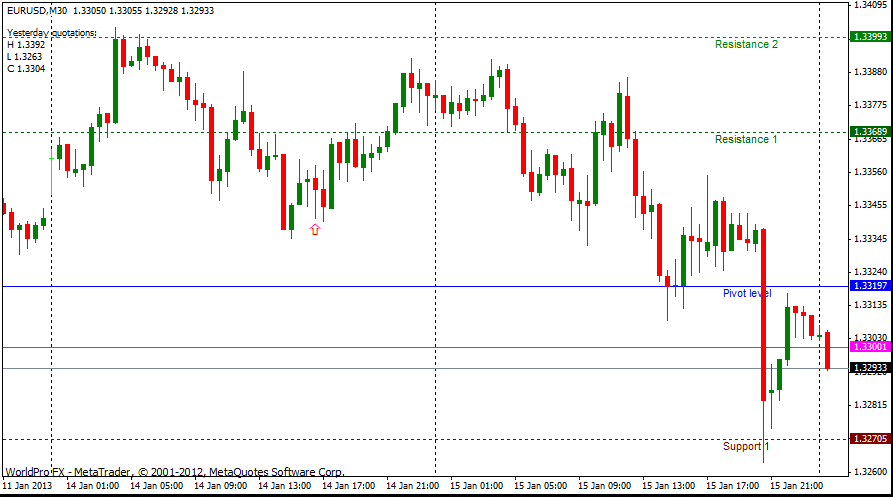
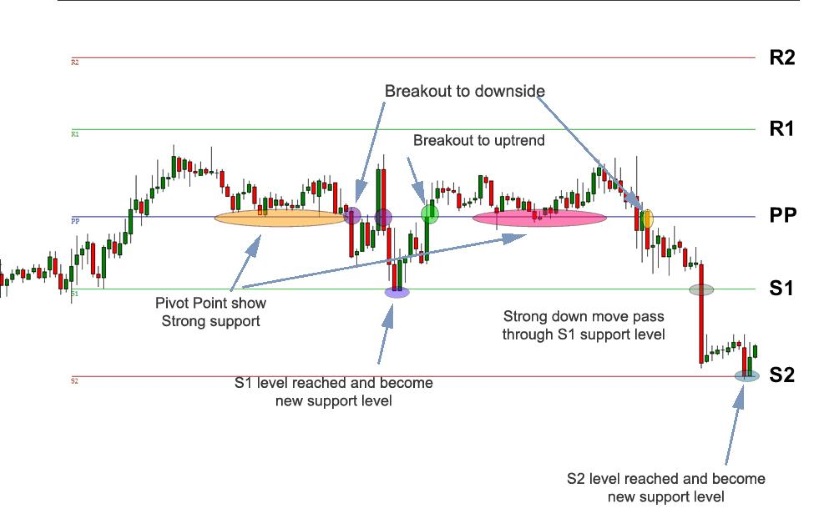
Support Resistance Binary Options
Those familiar with technical chart analysis have likely come across the term Pivot Points, which is a trading indicator that is used to gauge market trends over specific time frames. Broadly speaking, a Pivot Point is calculated by taking the daily high, the daily low, and the daily close seen in the previous session. This can be altered, however, depending on the time frame. So, if we were looking at an hourly chart, the calculated interval would be the previous hour. In a weekly chart, the calculated interval would be the previous week.
The Pivot Points are then used to determine potential changes in price action. When prices trade above a Pivot Point, bullish sentiment is prevailing in the market, and prices are expected to continue moving higher. When prices trade below a Pivot Point, bearish sentiment is prevailing in the market, and prices are expected to continue moving lower.
Understanding how prices are likely to move in the future can prove to be highly valuable when trading binary options, and when these movements are accurately forecast, large profits can be captured in a fairly short amount of time.
One of the ways that Pivot Points are most useful is in defining support and resistance levels. In many cases, support and resistance is calculated using the the price level of the pivot and marking the difference between the price high or low seen in the previous session. If prices break through once of these areas (either to the upside or to the downside) the next levels of support and resistance will be calculated using the price distance between the high and low from the previous session.
An upside break of the first support or resistance level targets the secondary support/resistance level. An example of these levels can be seen in the chart graphic below:
For traders that are looking to gain a more in-depth understanding of the exact formulas in calculating Pivot Points, an internet search will turn up various formulas or alternatively read our simple binary options trading strategies. But with modern trading stations, your platform will make these calculations for you and clearly mark them on your price chart. Once these levels are visible, we can start to use this information when placing actual binary options trades.
When dealing with binary options, our first task is always to get a sense of which direction prices are likely to travel going forward. If we believe prices will increase, we enter into CALL options. If we believe prices will decrease, we enter into PUT options. Pivot Points can be very useful in these forecasts, as the pivot itself marks the first level of support/resistance. Once prices rise above (or move below) this level, we can determine our directional bias. Since the pivot area itself is the most important price region, we can expect prices to move sharply once this level is breached.
So, for bullish trades (CALLS) we are looking for prices to rise above the pivot and continue moving higher until prices reach the next resistance area. At this point, the trade should be closed and profits should be taken. In bearish trades (PUTS) we are looking for prices to fall below the pivot and continue moving lower until prices reach the next support area. At this point, the trade should be exited.
Pivot points are just one of several types of price action that can provide profits to those who trade binary options. This forthcoming price action is typically easiest to spot when a pivot point calculator is used. This tool will help you to ascertain the future course of price movement, in conjunction with approximately how far the price may travel during a specific period of time.
These types of estimations are drawn from the typical price, as well as the highest and lowest price levels for a period of time. Support and resistance are added into the mix to deliver additional verification of the upcoming movement. When using a pivot point calculator, keep the settings at the “classic” formula (this will be automatic, just don’t make any changes). These specific settings can be applied to any type of trading, including the Forex markets and traditional markets. These calculators are available on the internet, usually at no cost, and will likely calculate and set the appropriate points for you instantly.
Pivot points offer you a realistic view of the price range of your chosen asset, especially when combined with extra indicators. The best use of pivot points will be to use them to recognize upcoming price direction reversals, as well as to recognize breakout points. They can also be used to ascertain excellent periods of market entry, providing the signal to trade just in advance of a price correction or total reversal of direction. Feel free to use this strategy along with any stock, commodity, index, or currency pair.
Try to remember that pivot points are important price levels. It’s going to be inside of these levels that a reversal of price direction is most likely to take place. Note, however, that the asset price might also pause for a moment after which it continues to shift in its previous direction. Given that obvious boundaries are going to be displayed when using the calculator, consider utilizing this binary options strategy along with instruments such as Long Term or One Touch.
The provided price levels will highlight both support and resistance areas. These along can clearly show the prime areas for likely reversals. Both brief and long-term changes can be detected. For instance, if the price starts out the market session being positioned above the middle pivot, conditions are bullish. If he opening price is greater than the 2nd point, expect bullish long-term movement, but bearish short-term movement. Use these conditions to enter into trades accordingly.
It should be stated that it is much more difficult to predict price corrections, reversals, and breakouts than it is to simply trade along with a trend. For this reason, novice traders should first master trend trading and then move on to working on forecasting more volatile types of price movement. Keep in mind that all types of price movement are caused directly by the actions that are taken by investors. This means that market news related to your chosen assets must be monitored even when using a binary options strategy which is technical in design.
Pivot Points can be a great tool for traders looking to gauge the general direction of the market. Modern trading stations plot these points easily, and once marked, these areas can be highly influential in helping traders determine whether they should enter into CALLS or PUTS for a given asset. One important point to remember is that Pivot Points are short term indicators, and these levels will change at the end of each session. Because of this, all trades should be kept within these time frames as price activity becomes less predictable in the following time periods.
How To Trade Breakouts
One inevitable truth about the markets is that expectations for price will never hold up 100% of the time. Strong levels of support or resistance that defined a market previously can always change, and what these events tell us is that the market itself is now operating by new rules. Let’s take a look at what a price breakout would look like on a chart:
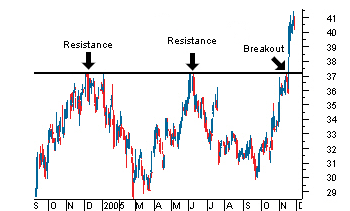
In this example, we can see that prices have broken to the upside by overcoming the previous resistance level. A break of resistance is a bullish event and the expectation is that prices will continue higher. A break of support to the downside would look similar (only reversed). A break of support is a bearish event and the expectation is that prices will continue lower. Upside breaks of resistance can be used as a basis for entering into CALL options, while downside breaks of support can be used when structuring PUT options.
At this stage you might be asking why breakout strategies are suitable for options trades. The answer to things comes from the fact that these price patterns are telling us that market dynamics are shifting. In addition to this, these breakouts tell us in which direction these shifts are heading. Since binary options allow of to benefit from simple directional forecasts, the information that is contained within breakout patterns can be highly valuable when constructing a trade idea.
In cases of resistance, there are large oppositional forces (bulls and bears) looking to gain market control at a critical historical price level. If the market is truly bearish, the sellers will win out. If the market is truly bullish, a breakout will occur and buyers will push through resistance. For technical traders, this is enough of a reason to take out a CALL option for a specific asset. Conversely, support levels contain the same type of information in terms of what it can tell us about the true nature of the market. Massive declines through support levels are typically used by technical traders as a reason to enter into PUT options.
When there is little to be seen in the way of fundamental data or significant news events, structuring trading ideas can be difficult. Luckily, there are alternative strategies that can be implemented by traders that are finding themselves at a loss for new trade ideas. One of the most popularly used strategies looks at significant breakouts of support or resistance, and this can he an incredibly easy way of finding new times to enter into CALLS and PUTS. Identifying strong breakouts can take a bit of practice to master but once they are seen on a regular basis, these events become much easier to spot.
Best Stochastic Settings For 15 Minute Chart
This binary options strategy provides trade signals by way of the Relative Strength Index (RSI) indicator as well as analysis of a pair of time-frames. The goal with this strategy is to recognize the prevailing trend and then trade along with it while it continues to remain in place. Inexperienced traders might have trouble with this strategy at first while tracking down the entry points. To protect yourself from problems, follow the instructions for each step exactly and never skip or repeat a step unless directed to.
Your technical chart needs to be set up beforehand. Begin by selecting the 15-minute and 5-minute charts. The first chart will be used for detecting the prevailing trend, while the second chart will be used to find the entry point. In the 15-minute chart, choose exponential moving averages (EMAs) of 50, 21, and 5. Your next move will be to draw support and resistance lines. These lines can originate from your individual estimations, or be drawn according to the present levels as furnished by industry professionals.
To ensure that the RSI is able to point out the best entry points, adjust the settings to 4-bars in order to view the trend inside the 15-minute chart, but bear in mind that the 5-minute chart is the place where you will discover the actual entry indication. The Stochastic will be utilized to supply further validation for entry and exit points. The employment of the Stochastic is elective, however the additional verification can easily make a difference in the general rate of success when using this strategy.
- Step 1: Begin by taking a look at the 15-minute chart. In the event that value of your selected underlying asset is in the vicinity of either support or resistance, see this as a negating element for any signals that you observe shifting in the same direction. Make use of moving averages to establish the current trend in this chart prior to moving forward.
- Step 2: examine the short-term averages to ascertain whether they are higher than the long-term 50-bar level. If that’s the case, the projected trend direction is ascending. If the averages are under the 50-bar, the projected trend is descending.
- Step 3: Hold out for the signal to trade. This appears as soon as the RSI moves directly into overbought or oversold locations. When this takes place, go on to the 5-minute chart and begin to watch for the entry signal.
- Step 4: Once back inside the 5-minute chart, start to look for the entry point. The indication should always be consistent with the exact same trend observed inside the 15-minute chart. In the event the price is in close proximity to areas of support or resistance, wait to find out if the price goes beyond these levels prior to trading. If you are planning to confirm using the Stochastic, this is the time to take action.
Take into account that this strategy was created exclusively to be used with the 5 and 15 minute charts. If applied using lengthier time-frames it’s going to be less reliable. Trade signals frequently appear suddenly and for that reason call for speedy actions. Furthermore, any market reports which happen to be circulated during the time you intend to trade can easily make a big difference. It is advisable to avoid using this binary options strategy in conjunction with any underlying asset which is linked to the discharge of new report information.